Findings: Accent Identification Reflection Handout
Quantitative Data.
The data gained from the Accent Identification Reflection Handout shows a trend favoring native-speaker pronunciation and accents. 60% of the students stated that native-speaker accents were the easiest to guess, 80% of the students answered that they found American, Canadian, or British accents to be the most attractive out of all the speakers, 85% of the students said that the native-speaker accents were the easiest to understand, and 100% of the students stated that they had heard at least one of the native-speaker accent prior to this activity. This shows us that not only are the students able to identify the native-speaker accents, but they also favor them and have been exposed to them before. The one exception is the Canadian accent. Although 35% of the students stated they had never heard this accent before, 20% of the students found it the easiest to understand and 30% said that it was the most attractive.
The data gained from the Accent Identification Reflection Handout shows a trend favoring native-speaker pronunciation and accents. 60% of the students stated that native-speaker accents were the easiest to guess, 80% of the students answered that they found American, Canadian, or British accents to be the most attractive out of all the speakers, 85% of the students said that the native-speaker accents were the easiest to understand, and 100% of the students stated that they had heard at least one of the native-speaker accent prior to this activity. This shows us that not only are the students able to identify the native-speaker accents, but they also favor them and have been exposed to them before. The one exception is the Canadian accent. Although 35% of the students stated they had never heard this accent before, 20% of the students found it the easiest to understand and 30% said that it was the most attractive.
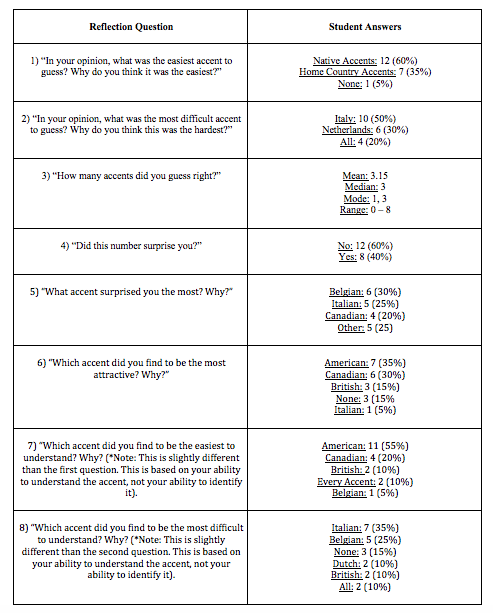
Figure 95: Reflection 3
|
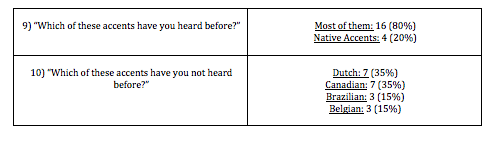
Figure 96: Reflection 4
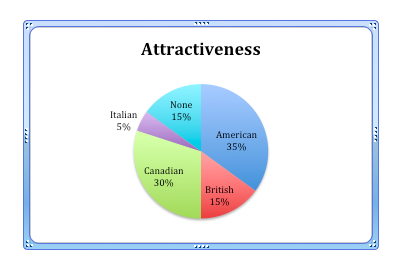
Figure 96: Reflection 5
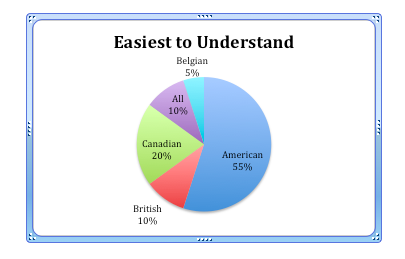
Figure 97: Reflection 6
|
Qualitative Data.
The qualitative data presented to us through the Accent Identification Reflection Handout gives a more in-depth perspective into the quantitative data. The students' answers show that there is a very strong relationship between being exposed to an accent and the ability to identify, understand, and enjoy it. Many of the students also used vocabulary such as "strong" and "big" to describe some of the reasons why identifying particular accents was difficult. It seems as though if the speaker had a "strong" or "big" accent, then the attractiveness of the accent would go down. The students identify "clear" and "good" as the opposites of "strong" and "big". However, it is important to note that they are measuring the accentedness of the accents to the native-speaker accents. Therefore, the further away the speaker's accent was from a native-speaker accent (in particular, an American one) the more difficult it was to identify and the less attractive it seemed to the students.
The qualitative data presented to us through the Accent Identification Reflection Handout gives a more in-depth perspective into the quantitative data. The students' answers show that there is a very strong relationship between being exposed to an accent and the ability to identify, understand, and enjoy it. Many of the students also used vocabulary such as "strong" and "big" to describe some of the reasons why identifying particular accents was difficult. It seems as though if the speaker had a "strong" or "big" accent, then the attractiveness of the accent would go down. The students identify "clear" and "good" as the opposites of "strong" and "big". However, it is important to note that they are measuring the accentedness of the accents to the native-speaker accents. Therefore, the further away the speaker's accent was from a native-speaker accent (in particular, an American one) the more difficult it was to identify and the less attractive it seemed to the students.
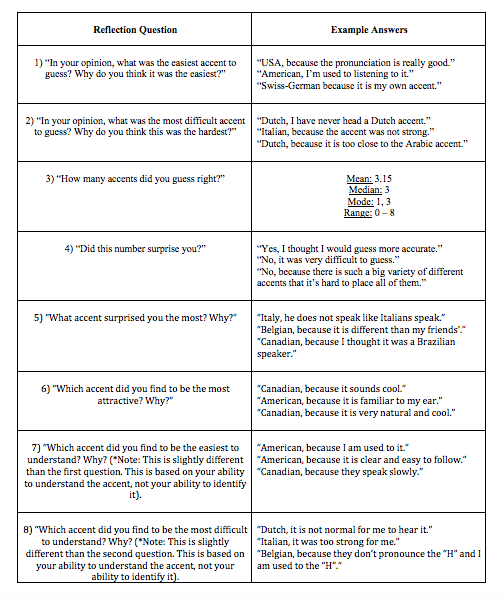
Figure 98: Reflection 7
|
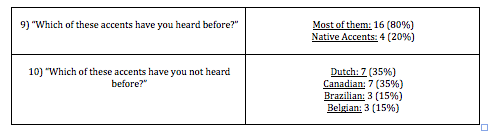
Figure 99: Reflection 8
Example.
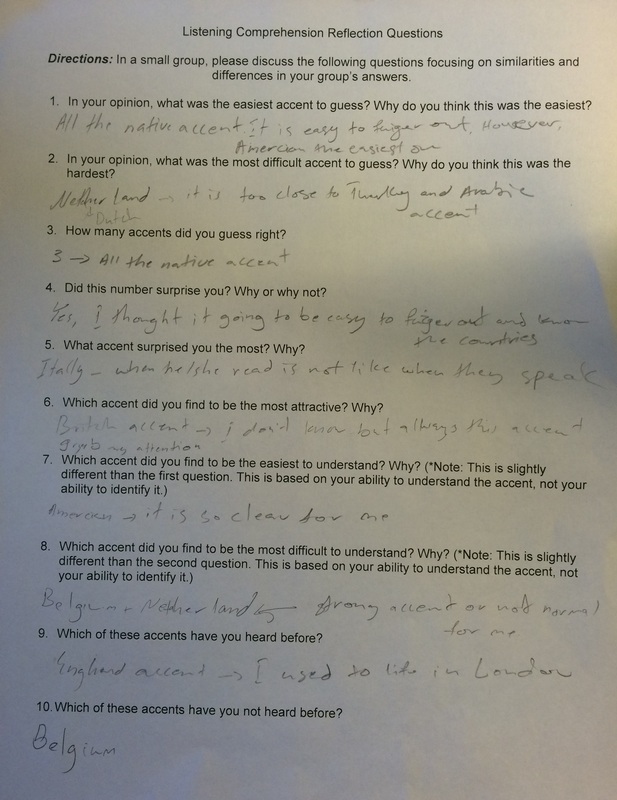
Figure 100: Reflection 9
|
