Findings: Redefined American Accent Worksheet
|
Quantitative Data from the American Accent Worksheet
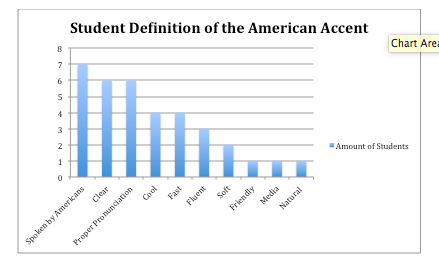
Figure 135: Student Redefinition 2
|
Quantitative Data from the Redefined American Accent Worksheet
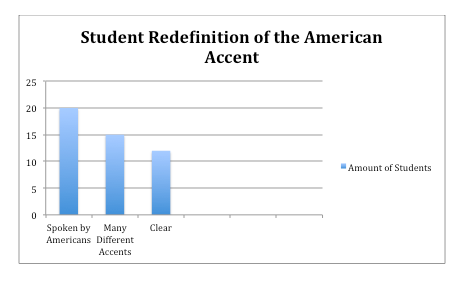
Figure 136: Student Redefinition 3
|
Quantitative Data Continued
The pie charts below show how significant the data changed from the original American Accent Worksheet to the Redefined American Accent Worksheet. When asked to rate the statement, "I think the American accent is attractive", 0% of the students strongly disagreed with the statement, 0% of the students disagreed with the statement (compared to 5% previously), 35% of the students responded with neutral (compared to 10% previously), 55% of the students responded with agree (compared to 70% previously), and 10% of the students stated that they strongly agree (compared to 15% previously).
The pie charts below show how significant the data changed from the original American Accent Worksheet to the Redefined American Accent Worksheet. When asked to rate the statement, "I think the American accent is attractive", 0% of the students strongly disagreed with the statement, 0% of the students disagreed with the statement (compared to 5% previously), 35% of the students responded with neutral (compared to 10% previously), 55% of the students responded with agree (compared to 70% previously), and 10% of the students stated that they strongly agree (compared to 15% previously).
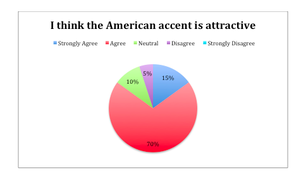
Figure 137: Student Rating 1
|

|
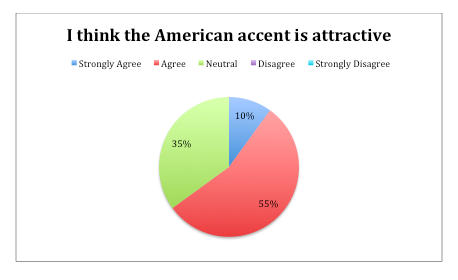
Figure 138: Student Rating 2
|
Qualitative Data
Strongly Agree: "Better than British", "Clear", "Understandable"
Agree: "Clear", "Understandable",
Neutral: "Depends on the accent"
Strongly Agree: "Better than British", "Clear", "Understandable"
Agree: "Clear", "Understandable",
Neutral: "Depends on the accent"
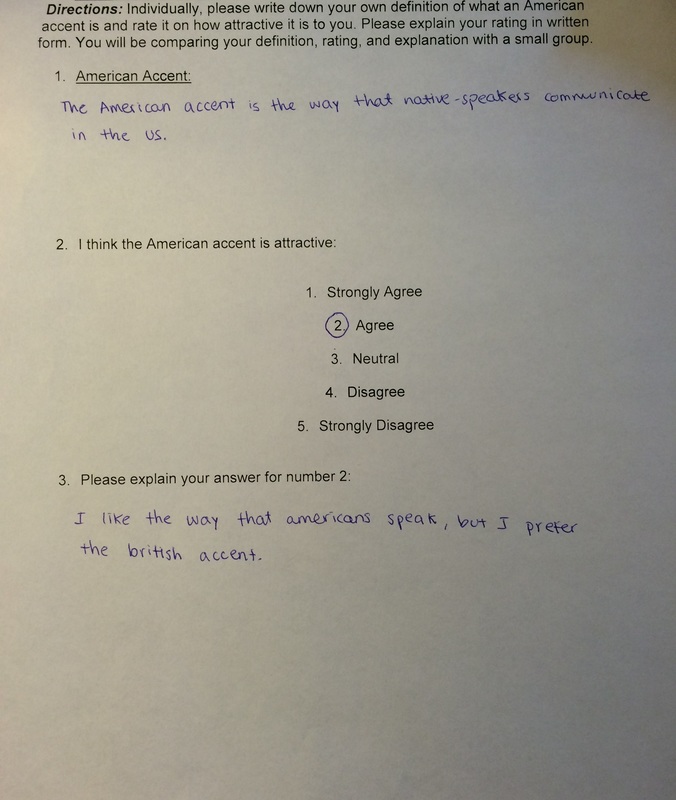
Figure 139: Redefinition Example
