Findings: Accent Identification Handout
Quantitative Data
From on the data identified on the Accent Identification Handouts, we can see a clear correlation between the native-speaker voice recordings and the students' abilities to discern where the speakers are from. Although there were three native-speakers within the ten, only the speaker from the U.K. and the speaker from the U.S. were easily identifiable. Only 15% of the students were able to accurately identify the speaker from Canada's home country. Interestingly, 65% of the students were able to correctly identify the Swiss speaker, which is the same amount of students who were able to accurately identify the speakers from the U.K. and the U.S. Out of the 10 speakers, the countries with the lowest percentage of correct student identification were The Netherlands, Italy, and Belgium at 0.5% and Saudi Arabia with 0%.
From on the data identified on the Accent Identification Handouts, we can see a clear correlation between the native-speaker voice recordings and the students' abilities to discern where the speakers are from. Although there were three native-speakers within the ten, only the speaker from the U.K. and the speaker from the U.S. were easily identifiable. Only 15% of the students were able to accurately identify the speaker from Canada's home country. Interestingly, 65% of the students were able to correctly identify the Swiss speaker, which is the same amount of students who were able to accurately identify the speakers from the U.K. and the U.S. Out of the 10 speakers, the countries with the lowest percentage of correct student identification were The Netherlands, Italy, and Belgium at 0.5% and Saudi Arabia with 0%.
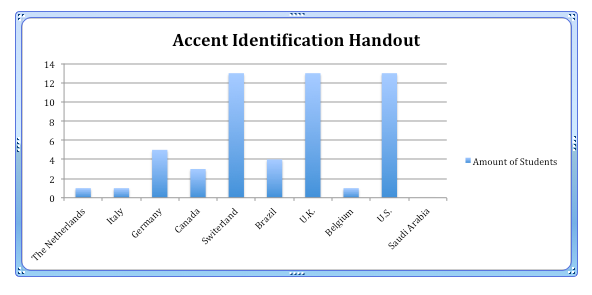
Figure 88: Accent Identification Handout 1
Although the majority of the students were able to correctly identify the native-speakers within the recordings, the analysis of the data from Question B, "I can understand this speaker", showed another strong corollary relationship. Out of all 20 students, who had to answer Question B ten time each, "disagree" was only recorded four times (2%). Furthermore, "strongly disagree" was recorded zero times (0%). 28% of the time students stated that they "strongly agree" that they could understand the speaker, 49% of the time students stated that they "agree" that they could understand the speaker, and 21% of the time the students stated that they were "neutral" when asked if they could understand the speaker. This shows that although the students were able to distinguish between a native-speaker and a non-native speaker, their overall comprehension of the speakers was high (77% of the time they agreed or strongly agreed that they could understand the speaker).
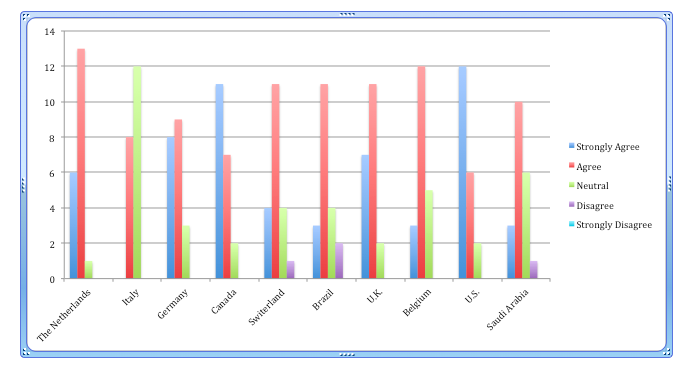
Figure 89: Accent Identification Handout 2
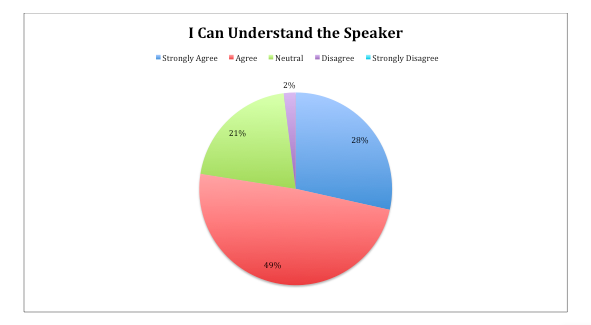
Figure 90: Accent Identification Handout 3
Examples
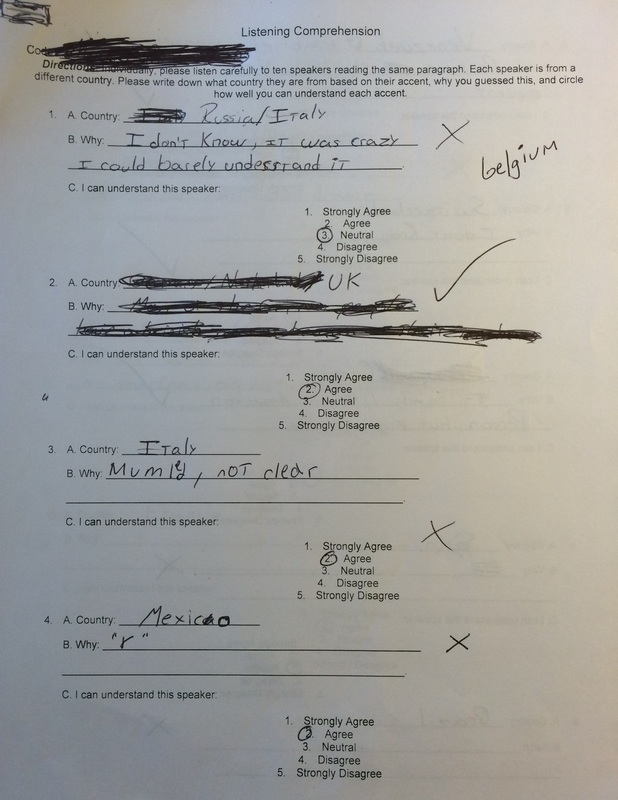
Figure 91: Accent Identification Handout 4
|
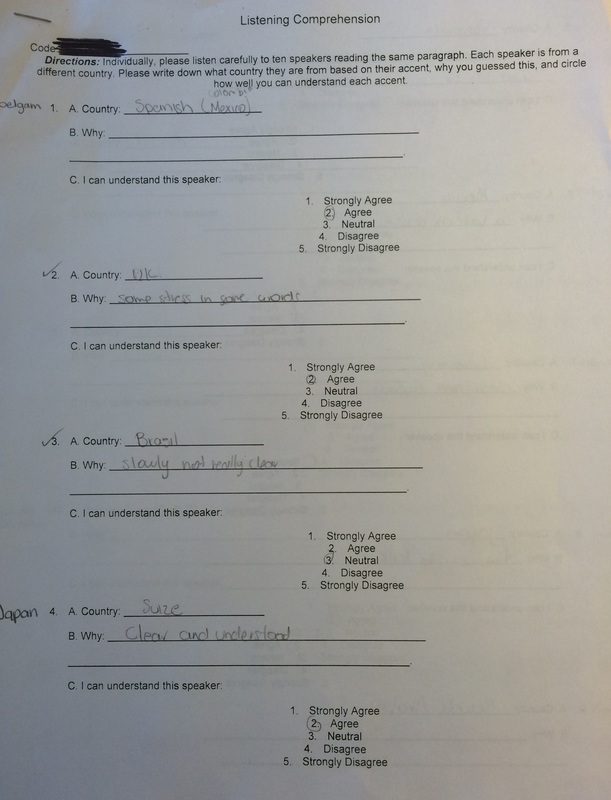
Figure 92: Accent Identification Handout 5
|
